zyq5945
COVID-19 Recovery: A Regional and Time-Period Comparison
🌐 中文版本
1. Ambient Temperature and Human Immunity
This article uses data to compare and analyze COVID-19 recovery across countries and regions. Let me first state a general pattern unrelated to the pandemic: for the same disease, deaths are markedly higher in winter than in summer. This is a worldwide phenomenon supported by extensive epidemiological data (specific figures can be found online). This pattern may involve multiple factors, including virus stability, indoor crowding, vitamin D deficiency, and the physiological burden the body bears in cold environments, and it does not necessarily mean temperature is an independent determining factor. From this we can hypothesize that when the ambient temperature deviates from the comfort zone, the energy the body spends maintaining its temperature increases, which may crowd out immune resources and in turn affect recovery.
What is the physiological mechanism behind this hypothesis? Let us compare from three angles: how far the ambient temperature deviates from the comfort zone, how the body uses its energy, and how the body responds.
First, three concepts need to be distinguished: ambient temperature, weather temperature, and perceived temperature.
- Ambient temperature: the air temperature of the space the body occupies, measured with a thermometer at any on-site location.
- Weather temperature: the air temperature measured by a weather station according to a uniform standard, with the thermometer placed in a Stevenson screen 1.5 meters above the ground, away from sunlight and well ventilated.
- Perceived temperature: the degree of heat or cold the body actually feels.
The comfortable ambient temperature range for the human body is roughly 19–23°C (sources differ slightly; this value is adopted here for now). Within this range, the body does not need to expend extra energy to regulate its temperature, and its metabolic rate is at its lowest. Once the temperature deviates from this range, the body activates energy-regulation mechanisms:
Below the Comfort Zone (Cold)
| Degree of deviation | Energy use | Bodily response |
|---|---|---|
| Mildly cold | Basal metabolic rate rises by 10–30%, with brown fat burned preferentially to generate heat | Skin blood vessels constrict (reducing heat loss), goosebumps appear (arrector pili muscles contract), hands and feet feel cold |
| Moderately cold | Skeletal muscles contract involuntarily to generate heat (shivering), and energy expenditure can double | Shivering, teeth chattering, stiff movements, impaired judgment |
| Severely cold | Core body temperature drops, the body sacrifices the limbs to protect the vital organs, and the metabolic rate actually falls | Confusion, dilated pupils, cardiac arrhythmia, and ultimately organ failure |
Core logic: the body shifts energy from “daily activities” toward “heat production and insulation,” at the cost of consuming glycogen and fat reserves.
Above the Comfort Zone (Heat)
| Degree of deviation | Energy use | Bodily response |
|---|---|---|
| Mildly hot | Metabolic rate drops slightly and energy expenditure decreases (similar to an energy-saving mode) | Skin blood vessels dilate (to dissipate heat), sweating increases, heart rate accelerates |
| Moderately hot | Large amounts of water and electrolytes are used for evaporative cooling, increasing the cardiovascular burden | Heavy sweating, thirst, fatigue, reduced concentration |
| Severely hot | The thermoregulatory center is disrupted, cellular metabolic enzymes are inactivated, and energy production is impaired | Heat cramps → heat exhaustion → heat stroke (core temperature > 40°C, multi-organ damage) |
Core logic: the body shifts energy from “muscle activity” toward the “heat-dissipation circulation,” at the cost of dehydration and electrolyte loss; once heat dissipation cannot keep up with heat production, metabolism itself collapses.
Summary
- Cold: the body “burns fuel to keep warm,” burning harder the colder it gets, until it can burn no more.
- Heat: the body “opens the floodgates to release water” to cool down; once the water runs dry, the engine overheats and stalls.
Putting the two cases together, the essence can be summed up in one sentence: the further one deviates from the comfort zone, the more energy the body spends maintaining its temperature. This energy could otherwise have been left to the immune system, so immunity declines — the “higher winter mortality” mentioned at the outset is precisely the macroscopic manifestation of this mechanism.
There is another point that is easy to confuse and worth clarifying: what truly affects the body is the ambient temperature, not the weather temperature recorded in meteorological observations (humidity, wind speed, and radiation also matter, but they are relatively secondary). Weather temperature can only serve as a rough proxy for ambient temperature. The Antarctic research stations offer an extreme example: the local weather temperature is extremely low, but the camps are heated around the clock, greatly improving the ambient temperature, so confirmed cases there were almost all mild or asymptomatic, with no severe cases and no reported deaths (the only Antarctic death occurred on a tourist cruise ship). This indirectly corroborates the link between ambient temperature and immunity, although the research-station personnel are statistically a low-risk group and the sample is too small to count as reliable evidence.
My judgment, therefore, is this: for the same virus strain, the probability of severe illness is higher in cold weather, while the probability of mild or asymptomatic illness is higher in warm weather. Whether this judgment holds must be tested against real data from various countries — below I first explain the method used to measure recovery.
It should be noted that the “energy allocation” in this section is only a speculative mechanism and lacks direct clinical evidence. Mechanisms more widely established in medicine include: winter vitamin D deficiency (multiple studies have confirmed its association with the risk of severe COVID-19), low humidity weakening the respiratory mucosal defenses, and increased indoor crowding in winter raising the viral exposure dose. Temperature is likely only a proxy for these factors, rather than an independent direct cause.
2. Calculation Method
The most commonly used metric for measuring recovery is deaths ÷ confirmed cases (i.e., the case fatality rate, CFR). This article instead adopts a new calculation method:
- Stage recoveries = cumulative recoveries at the end of the stage − cumulative recoveries at the start of the stage
- Stage deaths = cumulative deaths at the end of the stage − cumulative deaths at the start of the stage
- Stage total = stage recoveries + stage deaths
- Stage recovery rate = stage recoveries ÷ stage total
To observe both the overall level of care and the fluctuations within specific intervals, the starting point of the stage recovery rate can be chosen in two ways:
- Full-period stage recovery rate: computed from the point before the pandemic began (recoveries and deaths both 0), used to observe overall recovery.
- Interval stage recovery rate: computed from a specific point in time, used to observe recovery within that interval.
The fundamental difference between the old and new methods lies in whether the denominator includes “cases whose outcome is still pending,” which directly determines the metric’s explanatory power and applicable scenarios.
The Old Method: Deaths ÷ Confirmed Cases (the Case Fatality Rate, CFR)
Drawbacks
- Inflated denominator: the confirmed-case count includes many patients still hospitalized who have neither recovered nor died. In the early stage of an outbreak this rate is severely underestimated (the denominator is too large); in the later stage, as the backlog of cases is cleared, it suddenly jumps up.
- Conflates “recovery” and “death”: it reflects only the death proportion, not the recovery proportion, and therefore struggles to measure the real effect of medical treatment.
- Temporal mismatch: deaths reported today may come from infections confirmed weeks ago, so the numerator and denominator are misaligned on the time axis.
Advantages
- Simple and intuitive: it needs only two cumulative figures and can be computed directly from any public epidemic report.
- Highly real-time: it does not require waiting for patients to be discharged or to die; data is available every day.
- Horizontally comparable: different regions and different time points use the same metric, facilitating rapid comparison.
The New Method: Stage Recovery Rate = Stage Recoveries ÷ (Stage Recoveries + Stage Deaths)
Drawbacks
- High data requirements: it requires tracking the final outcome of every case, but many countries’ public data do not provide “recovery dates” or “stage recovery counts.”
- Subjective stage boundaries: how should the start and end of a stage be defined? Weekly, monthly, or by epidemic wave? Different choices yield very different results.
- Fluctuating sample size: if a stage happens to fall in a low point of the pandemic, both recoveries and deaths are few, and the computed rate swings wildly, with limited statistical significance.
- Inconsistent recovery criteria: different countries or periods define “recovery” differently (negative nucleic-acid test? symptom resolution? discharge?), so cross-stage or cross-country comparisons still require caution.
Advantages
- Only “closed” cases: the denominator includes only people with a definite outcome (recovered or deceased), excluding pending cases, so the result is closer to the true recovery/death ratio.
- Reflects changes in care quality: stage-wise computation can capture fluctuations in treatment outcomes across periods (e.g., after vaccine rollout, after new variants emerge, during healthcare-system overload).
- Consistent with epidemiological logic: it is essentially a “conditional probability,” namely the probability of recovery among cases with a known outcome.
Implicit Assumptions
There are two implicit assumptions behind the stage recovery rate that need to be stated. First, this article assumes that each country’s definition of “recovery” remained relatively stable over the analysis period — yet in practice many countries later relaxed the criterion to “discharge counts as recovery,” or even stopped tracking recovery counts, and such changes in definition can artificially raise or lower the rate. Second, the stage recovery rate records the time when the outcome occurs (when someone recovers or dies), whereas infection typically precedes the outcome by 2–8 weeks: many of the cases in the winter interval were in fact infected in autumn, and those in the summer interval in late spring or early summer. It therefore reflects the overall situation of “cases whose outcomes fell within that interval,” and there is a lag between this and “infection during that interval,” so caution is needed when interpreting the results.
Summary
The old method is suited to quickly gauging the overall severity of an outbreak, but its figures are distorted by “unresolved cases.” The new method is better suited to assessing the effectiveness of medical treatment in a specific period under specific conditions, but it imposes higher demands on data quality and stage design. For serious retrospective analyses of an epidemic or evaluations of care quality, the new method is more reliable; for day-to-day monitoring of public sentiment, the old method is more practical. In addition, the new method also makes it easier to compare different periods within the same region, and different regions against one another.
3. Global Full-Period Stage Recovery Rate
This section uses the CSSEGISandData COVID-19 data and the HTML5 Stage Recovery Rate Analyzer (Code repository and usage instructions) to perform the analysis. To avoid noise from insufficient data, the filtering criteria are as follows: at least 10,000 stage recoveries; at least 1 death; a confidence rate between 80% and 100%; sorted by stage recovery rate in descending order. The confirmed count, confidence rate, and 2020 GDP per capita are also added as supplementary fields, producing the table below.
| Region | End | Stage Recovery | Stage Death | Stage Total | Recovery Rate | Confirmed | Confidence Rate | Long | Lat | 2020Gdp |
|---|---|---|---|---|---|---|---|---|---|---|
| Singapore | 2021/8/1 | 62957 | 37 | 62994 | 99.94% | 65102 | 96.76% | 103.8333 | 1.2833 | 61773 |
| Qatar | 2021/8/1 | 223849 | 601 | 224450 | 99.73% | 226390 | 99.14% | 51.1839 | 25.3548 | 51684 |
| Maldives | 2021/8/1 | 74758 | 221 | 74979 | 99.71% | 77547 | 96.69% | 73.2207 | 3.2028 | 7394 |
| United Arab Emirates | 2021/8/1 | 659664 | 1951 | 661615 | 99.71% | 682377 | 96.96% | 53.847818 | 23.424076 | 37992 |
| Mongolia | 2021/8/1 | 164829 | 716 | 165545 | 99.57% | 166210 | 99.60% | 103.8467 | 46.8625 | 4001 |
| Seychelles | 2021/8/1 | 17538 | 86 | 17624 | 99.51% | 18362 | 95.98% | 55.492 | -4.6796 | 14041 |
| Bahrain | 2021/8/1 | 266921 | 1384 | 268305 | 99.48% | 269303 | 99.63% | 50.55 | 26.0275 | 24343 |
| Kuwait | 2021/8/1 | 385401 | 2328 | 387729 | 99.40% | 398538 | 97.29% | 47.481766 | 29.31166 | 25236 |
| Gabon | 2021/8/1 | 25166 | 164 | 25330 | 99.35% | 25384 | 99.79% | 11.6094 | -0.8037 | 6606 |
| Cote d’Ivoire | 2021/8/1 | 49389 | 330 | 49719 | 99.34% | 50278 | 98.89% | -5.5471 | 7.54 | 2180 |
| Uzbekistan | 2021/8/1 | 123995 | 880 | 124875 | 99.30% | 130216 | 95.90% | 64.585262 | 41.377491 | 2088 |
| Israel | 2021/8/1 | 850839 | 6477 | 857316 | 99.24% | 875801 | 97.89% | 34.851612 | 31.046051 | 44591 |
| France/French Polynesia | 2021/8/1 | 19206 | 149 | 19355 | 99.23% | 20048 | 96.54% | 149.4068 | -17.6797 | 39170 |
| Belarus | 2021/8/1 | 441369 | 3464 | 444833 | 99.22% | 446998 | 99.52% | 27.9534 | 53.7098 | 6543 |
| France/Reunion | 2021/8/1 | 33894 | 275 | 34169 | 99.20% | 37231 | 91.78% | 55.5364 | -21.1151 | 39170 |
| Cuba | 2021/8/1 | 348487 | 2845 | 351332 | 99.19% | 394343 | 89.09% | -77.781167 | 21.521757 | 9605 |
| Denmark | 2021/8/1 | 303958 | 2549 | 306507 | 99.17% | 317700 | 96.48% | 9.5018 | 56.2639 | 60985 |
| Tajikistan | 2021/8/1 | 14556 | 122 | 14678 | 99.17% | 15550 | 94.39% | 71.2761 | 38.861 | 834 |
| Ghana | 2021/8/1 | 97213 | 823 | 98036 | 99.16% | 103019 | 95.16% | -1.0232 | 7.9465 | 2195 |
| Andorra | 2021/8/1 | 14210 | 128 | 14338 | 99.11% | 14678 | 97.68% | 1.5218 | 42.5063 | 37361 |
| Cabo Verde | 2021/8/1 | 33036 | 298 | 33334 | 99.11% | 33822 | 98.56% | -23.0418 | 16.5388 | 3539 |
| Turkey | 2021/8/1 | 5459899 | 51428 | 5511327 | 99.07% | 5747935 | 95.88% | 35.2433 | 38.9637 | 8798 |
| Guinea | 2021/8/1 | 24242 | 229 | 24471 | 99.06% | 25801 | 94.85% | -9.6966 | 9.9456 | 1054 |
| Netherlands/Aruba | 2021/8/1 | 11176 | 110 | 11286 | 99.03% | 11765 | 95.93% | -69.9683 | 12.5211 | 53468 |
| Netherlands/Curacao | 2021/8/1 | 12926 | 127 | 13053 | 99.03% | 13669 | 95.49% | -68.99 | 12.1696 | 53468 |
| Estonia | 2021/8/1 | 128902 | 1272 | 130174 | 99.02% | 133685 | 97.37% | 25.0136 | 58.5953 | 23934 |
| Malaysia | 2021/8/1 | 925963 | 9184 | 935147 | 99.02% | 1130422 | 82.73% | 101.975766 | 4.210484 | 9958 |
| Togo | 2021/8/1 | 14493 | 153 | 14646 | 98.96% | 15870 | 92.29% | 0.8248 | 8.6195 | 961 |
| Papua New Guinea | 2021/8/1 | 17324 | 192 | 17516 | 98.90% | 17717 | 98.87% | 143.95555 | -6.314993 | 2430 |
| South Sudan | 2021/8/1 | 10514 | 119 | 10633 | 98.88% | 11049 | 96.23% | 31.307 | 6.877 | 322 |
| Luxembourg | 2021/8/1 | 71867 | 822 | 72689 | 98.87% | 73870 | 98.40% | 6.1296 | 49.8153 | 116860 |
| West Bank and Gaza | 2021/8/1 | 311918 | 3604 | 315522 | 98.86% | 316861 | 99.58% | 35.2332 | 31.9522 | 3234 |
| Korea, South | 2021/8/1 | 176605 | 2099 | 178704 | 98.83% | 201002 | 88.91% | 127.766922 | 35.907757 | 33646 |
| Dominican Republic | 2021/8/1 | 323700 | 3963 | 327663 | 98.79% | 342267 | 95.73% | -70.1627 | 18.7357 | 7135 |
| Venezuela | 2021/8/1 | 291556 | 3607 | 295163 | 98.78% | 306673 | 96.25% | -66.5897 | 6.4238 | 1506 |
| Burkina Faso | 2021/8/1 | 13369 | 169 | 13538 | 98.75% | 13588 | 99.63% | -1.5616 | 12.2383 | 825 |
| Iraq | 2021/8/1 | 1472093 | 18734 | 1490827 | 98.74% | 1635993 | 91.13% | 43.679291 | 33.223191 | 4295 |
| Nigeria | 2021/8/1 | 165005 | 2149 | 167154 | 98.71% | 174315 | 95.89% | 8.6753 | 9.082 | 2797 |
| Malta | 2021/8/1 | 31843 | 423 | 32266 | 98.69% | 34375 | 93.86% | 14.3754 | 35.9375 | 31823 |
| Jordan | 2021/8/1 | 751177 | 10048 | 761225 | 98.68% | 771753 | 98.64% | 36.51 | 31.24 | 4411 |
| Djibouti | 2021/8/1 | 11490 | 156 | 11646 | 98.66% | 11652 | 99.95% | 42.5903 | 11.8251 | 2845 |
| India | 2021/8/1 | 30857467 | 424773 | 31282240 | 98.64% | 31695958 | 98.69% | 78.96288 | 20.593684 | 1907 |
| Oman | 2021/8/1 | 279892 | 3850 | 283742 | 98.64% | 296835 | 95.59% | 55.923255 | 21.512583 | 16785 |
| Congo (Brazzaville) | 2021/8/1 | 12421 | 178 | 12599 | 98.59% | 13186 | 95.55% | 15.8277 | -0.228 | 1994 |
| Lebanon | 2021/8/1 | 537111 | 7909 | 545020 | 98.55% | 562527 | 96.89% | 35.8623 | 33.8547 | 5561 |
| Nepal | 2021/8/1 | 656197 | 9875 | 666072 | 98.52% | 697370 | 95.51% | 84.25 | 28.1667 | 1154 |
| Azerbaijan | 2021/8/1 | 333128 | 5027 | 338155 | 98.51% | 344520 | 98.15% | 47.5769 | 40.1431 | 4230 |
| Costa Rica | 2021/8/1 | 329639 | 5030 | 334669 | 98.50% | 406814 | 82.27% | -83.7534 | 9.7489 | 12476 |
| Georgia | 2021/8/1 | 384712 | 5853 | 390565 | 98.50% | 422188 | 92.51% | 43.3569 | 42.3154 | 4301 |
| Kyrgyzstan | 2021/8/1 | 146061 | 2335 | 148396 | 98.43% | 163846 | 90.57% | 74.766098 | 41.20438 | 1230 |
| Uruguay | 2021/8/1 | 373636 | 5966 | 379602 | 98.43% | 381569 | 99.48% | -55.7658 | -32.5228 | 15758 |
| Sri Lanka | 2021/8/1 | 278910 | 4503 | 283413 | 98.41% | 311349 | 91.03% | 80.771797 | 7.873054 | 3848 |
| Saudi Arabia | 2021/8/1 | 507374 | 8249 | 515623 | 98.40% | 526814 | 97.88% | 45.079162 | 23.885942 | 24339 |
| Lithuania | 2021/8/1 | 269323 | 4412 | 273735 | 98.39% | 283427 | 96.58% | 23.8813 | 55.1694 | 20429 |
| Panama | 2021/8/1 | 417137 | 6833 | 423970 | 98.39% | 436475 | 97.14% | -80.7821 | 8.538 | 13291 |
| Botswana | 2021/8/1 | 95323 | 1569 | 96892 | 98.38% | 106690 | 90.82% | 24.6849 | -22.3285 | 6323 |
| Montenegro | 2021/8/1 | 99011 | 1630 | 100641 | 98.38% | 102092 | 98.58% | 19.37439 | 42.708678 | 7555 |
| Ethiopia | 2021/8/1 | 263587 | 4390 | 267977 | 98.36% | 280565 | 95.51% | 40.4897 | 9.145 | 830 |
| Kazakhstan | 2021/8/1 | 537722 | 9077 | 546799 | 98.34% | 649207 | 84.23% | 66.9237 | 48.0196 | 8782 |
| Morocco | 2021/8/1 | 566008 | 9833 | 575841 | 98.29% | 629717 | 91.44% | -7.0926 | 31.7917 | 3268 |
| Slovenia | 2021/8/1 | 253763 | 4429 | 258192 | 98.28% | 259273 | 99.58% | 14.9955 | 46.1512 | 25392 |
| China/Hong Kong | 2021/8/1 | 11715 | 212 | 11927 | 98.22% | 11987 | 99.50% | 114.2 | 22.3 | 10627 |
| Japan | 2021/8/1 | 839090 | 15198 | 854288 | 98.22% | 936852 | 91.19% | 138.252924 | 36.204824 | 41099 |
| Zambia | 2021/8/1 | 188106 | 3406 | 191512 | 98.22% | 196293 | 97.56% | 27.849332 | -13.133897 | 952 |
| Czechia | 2021/8/1 | 1640599 | 30374 | 1670973 | 98.18% | 1673694 | 99.84% | 15.473 | 49.8175 | 23473 |
| Philippines | 2021/8/1 | 1506027 | 28016 | 1534043 | 98.17% | 1597689 | 96.02% | 121.774017 | 12.879721 | 3228 |
| Albania | 2021/8/1 | 130243 | 2457 | 132700 | 98.15% | 133121 | 99.68% | 20.1683 | 41.1533 | 6028 |
| Latvia | 2021/8/1 | 135583 | 2556 | 138139 | 98.15% | 138899 | 99.45% | 24.6032 | 56.8796 | 17564 |
| Bangladesh | 2021/8/1 | 1093266 | 20916 | 1114182 | 98.12% | 1264328 | 88.12% | 90.3563 | 23.685 | 2249 |
| Portugal | 2021/8/1 | 903514 | 17369 | 920883 | 98.11% | 970937 | 94.84% | -8.2245 | 39.3999 | 22299 |
| Cambodia | 2021/8/1 | 70754 | 1420 | 72174 | 98.03% | 77914 | 92.63% | 104.9167 | 11.55 | 2082 |
| Kenya | 2021/8/1 | 189131 | 3946 | 193077 | 97.96% | 203680 | 94.79% | 37.9062 | -0.0236 | 1928 |
| Armenia | 2021/8/1 | 219986 | 4619 | 224605 | 97.94% | 230339 | 97.51% | 45.0382 | 40.0691 | 4269 |
| Kosovo | 2021/8/1 | 105660 | 2269 | 107929 | 97.90% | 108465 | 99.51% | 20.902977 | 42.602636 | 4321 |
| Chile | 2021/8/1 | 1571788 | 35528 | 1607316 | 97.79% | 1616942 | 99.40% | -71.543 | -35.6751 | 13118 |
| Bahamas | 2021/8/1 | 12606 | 287 | 12893 | 97.77% | 14840 | 86.88% | -78.035889 | 25.025885 | 26179 |
| Madagascar | 2021/8/1 | 41151 | 943 | 42094 | 97.76% | 42665 | 98.66% | 46.869107 | -18.766947 | 451 |
| Argentina | 2021/8/1 | 4581132 | 105772 | 4686904 | 97.74% | 4935847 | 94.96% | -63.6167 | -38.4161 | 8536 |
| Croatia | 2021/8/1 | 354393 | 8263 | 362656 | 97.72% | 363758 | 99.70% | 15.2 | 45.1 | 14808 |
| Ukraine | 2021/8/1 | 2256053 | 55577 | 2311630 | 97.60% | 2334433 | 99.02% | 31.1656 | 48.3794 | 3710 |
| Moldova | 2021/8/1 | 252104 | 6255 | 258359 | 97.58% | 259549 | 99.54% | 28.3699 | 47.4116 | 4376 |
| Pakistan | 2021/8/1 | 943020 | 23462 | 966482 | 97.57% | 1039695 | 92.96% | 69.3451 | 30.3753 | 1278 |
| Belize | 2021/8/1 | 13420 | 337 | 13757 | 97.55% | 14163 | 97.13% | -88.4976 | 17.1899 | 5239 |
| Germany | 2021/8/1 | 3654720 | 91637 | 3746357 | 97.55% | 3766765 | 99.46% | 10.451526 | 51.165691 | 47395 |
| Mauritania | 2021/8/1 | 22406 | 567 | 22973 | 97.53% | 25973 | 88.45% | -10.9408 | 21.0079 | 1796 |
| Jamaica | 2021/8/1 | 47001 | 1196 | 48197 | 97.52% | 53237 | 90.53% | -77.2975 | 18.1096 | 5299 |
| Guyana | 2021/8/1 | 21183 | 541 | 21724 | 97.51% | 22523 | 96.45% | -58.93018 | 4.860416 | 6776 |
| Colombia | 2021/8/1 | 4587754 | 120998 | 4708752 | 97.43% | 4794414 | 98.21% | -74.2973 | 4.5709 | 5340 |
| Iran | 2021/8/1 | 3385195 | 90996 | 3476191 | 97.38% | 3903519 | 89.05% | 53.688046 | 32.427908 | 3203 |
| Angola | 2021/8/1 | 37397 | 1016 | 38413 | 97.36% | 42815 | 89.72% | 17.8739 | -11.2027 | 1749 |
| Russia | 2021/8/1 | 5556831 | 156726 | 5713557 | 97.26% | 6207513 | 92.04% | 105.318756 | 61.52401 | 10108 |
| Poland | 2021/8/1 | 2653807 | 75261 | 2729068 | 97.24% | 2883029 | 94.66% | 19.1451 | 51.9194 | 16151 |
| Suriname | 2021/8/1 | 21770 | 651 | 22421 | 97.10% | 25402 | 88.26% | -56.0278 | 3.9193 | 4755 |
| Italy | 2021/8/1 | 4135930 | 128068 | 4263998 | 97.00% | 4355348 | 97.90% | 12.56738 | 41.87194 | 32091 |
| Brazil | 2021/8/1 | 17771228 | 557091 | 18328319 | 96.96% | 19942499 | 91.91% | -51.9253 | -14.235 | 7074 |
| Namibia | 2021/8/1 | 95913 | 3057 | 98970 | 96.91% | 119285 | 82.97% | 18.4904 | -22.9576 | 3879 |
| Guatemala | 2021/8/1 | 324332 | 10413 | 334745 | 96.89% | 369626 | 90.56% | -90.2308 | 15.7835 | 4478 |
| Uganda | 2021/8/1 | 84052 | 2696 | 86748 | 96.89% | 94195 | 92.09% | 32.290275 | 1.373333 | 846 |
| South Africa | 2021/8/1 | 2230871 | 72191 | 2303062 | 96.87% | 2456184 | 93.77% | 22.9375 | -30.5595 | 5581 |
| Romania | 2021/8/1 | 1047767 | 34286 | 1082053 | 96.83% | 1083341 | 99.88% | 24.9668 | 45.9432 | 13009 |
| Trinidad and Tobago | 2021/8/1 | 31941 | 1084 | 33025 | 96.72% | 38930 | 84.83% | -61.2225 | 10.6918 | 15284 |
| Indonesia | 2021/8/1 | 2809538 | 95723 | 2905261 | 96.71% | 3440396 | 84.45% | 113.9213 | -0.7893 | 3854 |
| El Salvador | 2021/8/1 | 76265 | 2641 | 78906 | 96.65% | 86620 | 91.09% | -88.8965 | 13.7942 | 3997 |
| Paraguay | 2021/8/1 | 421051 | 15042 | 436093 | 96.55% | 452698 | 96.33% | -58.4438 | -23.4425 | 5365 |
| North Macedonia | 2021/8/1 | 150371 | 5493 | 155864 | 96.48% | 156452 | 99.62% | 21.7453 | 41.6086 | 6660 |
| Eswatini | 2021/8/1 | 21047 | 798 | 21845 | 96.35% | 26220 | 83.31% | 31.4659 | -26.5225 | 3467 |
| Mali | 2021/8/1 | 13948 | 533 | 14481 | 96.32% | 14587 | 99.27% | -3.996166 | 17.570692 | 953 |
| Tunisia | 2021/8/1 | 516831 | 20067 | 536898 | 96.26% | 595532 | 90.15% | 9.537499 | 33.886917 | 3549 |
| Hungary | 2021/8/1 | 748157 | 30026 | 778183 | 96.14% | 809491 | 96.13% | 19.5033 | 47.1625 | 16387 |
| Australia/Victoria | 2021/8/1 | 19996 | 820 | 20816 | 96.06% | 20950 | 99.36% | 144.9631 | -37.8136 | 51983 |
| Bolivia | 2021/8/1 | 408577 | 17839 | 426416 | 95.82% | 473899 | 89.98% | -63.5887 | -16.2902 | 3581 |
| Bulgaria | 2021/8/1 | 398554 | 18215 | 416769 | 95.63% | 425148 | 98.03% | 25.4858 | 42.7339 | 10761 |
| Bosnia and Herzegovina | 2021/8/1 | 189369 | 9687 | 199056 | 95.13% | 205655 | 96.79% | 17.6791 | 43.9159 | 6130 |
| Taiwan* | 2021/8/1 | 12879 | 789 | 13668 | 94.23% | 15688 | 87.12% | 121 | 23.7 | 28705 |
| China/Hubei | 2021/8/1 | 63665 | 4512 | 68177 | 93.38% | 68198 | 99.97% | 112.2707 | 30.9756 | 10627 |
| Ecuador | 2021/8/1 | 443880 | 31634 | 475514 | 93.35% | 487598 | 97.52% | -78.1834 | -1.8312 | 5464 |
| Egypt | 2021/8/1 | 230699 | 16528 | 247227 | 93.31% | 284311 | 86.96% | 30.802498 | 26.820553 | 3511 |
| Syria | 2021/8/1 | 21995 | 1916 | 23911 | 91.99% | 25983 | 92.03% | 38.9968 | 34.8021 | 594 |
| Sudan | 2021/8/1 | 30647 | 2776 | 33423 | 91.69% | 37138 | 90.00% | 30.2176 | 12.8628 | 578 |
| Mexico | 2021/8/1 | 2226594 | 241034 | 2467628 | 90.23% | 2854992 | 86.43% | -102.5528 | 23.6345 | 8841 |
In addition to the base fields, the table adds three columns: confirmed count, confidence rate, and 2020 GDP per capita (see below for the definition of the confidence rate).
Note: confidence rate = (recoveries + deaths) ÷ confirmed cases. The closer it is to 100%, the more complete the outcome reporting of cases; below 80% indicates that many cases have not yet reported an outcome (still hospitalized, underreported, or due to definitional issues); above 100% indicates an error in the statistics.
Summary
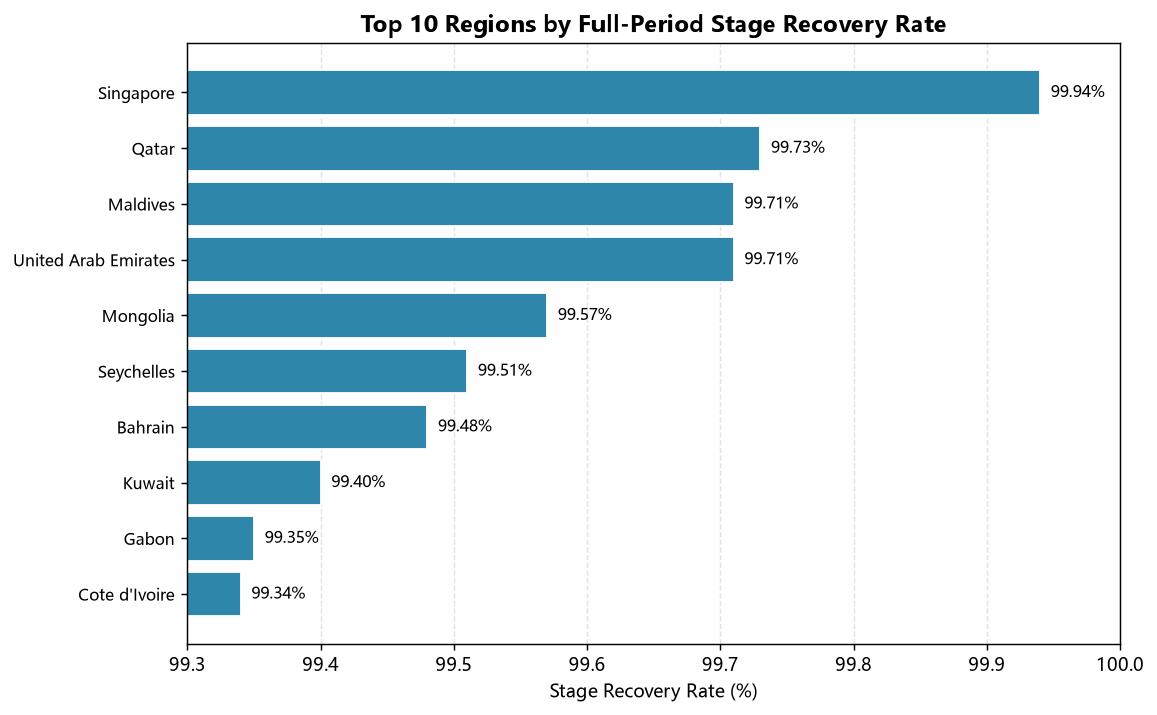
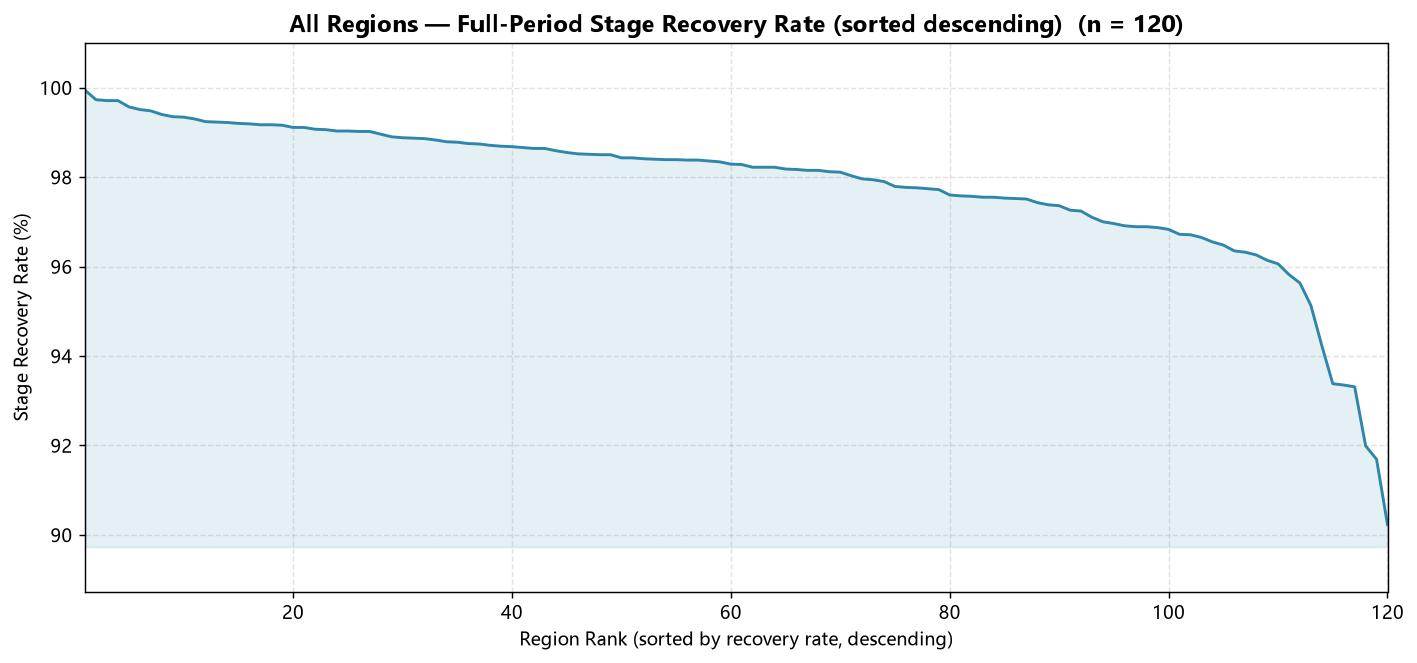
Among the top ten regions by stage recovery rate, except for Mongolia, the absolute values of the latitudes of the remaining regions are all within 30°, and their historical weather tends to be warm. These ten regions can be further divided into three tiers: Singapore is in the first tier and stands alone; Qatar, the Maldives, and the United Arab Emirates form the second tier; the remaining regions form the third. The top ten regions are concentrated in low-latitude warm zones, consistent with the direction of the judgment in Section 1: recovery rates are higher in warm environments.
Note: Mongolia is at latitude 46.86°, and its confirmed count on 2021-07-31 exceeds the sum of its recoveries and deaths, so the data are suspected to be erroneous; it is therefore excluded from the latitude statistics.
Singapore’s weather is distinctive. According to the historical weather data from 2020-04-01 to 2021-08-01, the local minimum temperature ranges from 22.9°C to 27.5°C, and the maximum from 24.6°C to 33.7°C. Singapore has a small land area, so the nationwide temperature difference is usually only 1–3°C, and the temperature at a single point can essentially represent the whole country (something large countries find hard to achieve).
4. Global Cold/Hot Period Stage Recovery Rate
The above comparison looks at overall differences between regions (a cross-sectional dimension); here we switch to the time dimension and examine how the same region changes between summer and winter periods.
| This section uses the CSSEGISandData COVID-19 data and selects regions with large temperature variation and large data volume, analyzed via the analyzer tool. To avoid noise from insufficient data, regions with at least 3,000 stage recoveries, at least 1 recovery and 1 death, and a 2020 GDP per capita above $8,000 are selected. The period 2020-06-01 to 2020-09-01 is taken as the first comparison group (summer in the Northern Hemisphere / winter in the Southern Hemisphere) and 2020-12-01 to 2021-03-01 as the second (winter in the Northern Hemisphere / summer in the Southern Hemisphere). Only regions with recovery-rate data for both intervals are retained, sorted by latitude in descending order ( | latitude | ≥ 35°), with a confidence rate between 70% and 100% (since sample sizes shrink after splitting into intervals, this threshold is relaxed from the 80% used in Section 3 to 70%), and supplemented with other fields to produce the table below. |
| Region | Start | Start Recovery | Start Death | End | End Recovery | End Death | Stage Recovery | Stage Death | Stage Total | Recovery Rate | Recovery Rate Change | Confirmed | Confidence Rate | Long | Lat | 2020Gdp | Expectation |
|---|---|---|---|---|---|---|---|---|---|---|---|---|---|---|---|---|---|
| Russia | 2020/6/1 | 175514 | 4849 | 2020/9/1 | 813603 | 17250 | 638089 | 12401 | 650490 | 98.09% | — | 997072 | 83.33% | 105.318756 | 61.52401 | 10108 | — |
| Russia | 2020/12/1 | 1787962 | 40050 | 2021/3/1 | 3780195 | 85025 | 1992233 | 44975 | 2037208 | 97.79% | -0.30% | 4209850 | 91.81% | 105.318756 | 61.52401 | 10108 | TRUE |
| Denmark | 2020/6/1 | 10412 | 576 | 2020/9/1 | 15300 | 625 | 4888 | 49 | 4937 | 99.01% | — | 17084 | 93.22% | 9.5018 | 56.2639 | 60985 | — |
| Denmark | 2020/12/1 | 64757 | 846 | 2021/3/1 | 202517 | 2365 | 137760 | 1519 | 139279 | 98.91% | -0.10% | 211692 | 96.78% | 9.5018 | 56.2639 | 60985 | TRUE |
| Poland | 2020/6/1 | 11449 | 1074 | 2020/9/1 | 47030 | 2058 | 35581 | 984 | 36565 | 97.31% | — | 67922 | 72.27% | 19.1451 | 51.9194 | 16151 | — |
| Poland | 2020/12/1 | 597589 | 17599 | 2021/3/1 | 1430861 | 43793 | 833272 | 26194 | 859466 | 96.95% | -0.36% | 1711772 | 86.15% | 19.1451 | 51.9194 | 16151 | TRUE |
| Germany | 2020/6/1 | 165632 | 8511 | 2020/9/1 | 218403 | 9302 | 52771 | 791 | 53562 | 98.52% | — | 243599 | 93.48% | 10.451526 | 51.165691 | 47395 | — |
| Germany | 2020/12/1 | 769380 | 16636 | 2021/3/1 | 2260719 | 70105 | 1491339 | 53469 | 1544808 | 96.54% | -1.98% | 2447068 | 95.25% | 10.451526 | 51.165691 | 47395 | TRUE |
| Czechia | 2020/6/1 | 6642 | 321 | 2020/9/1 | 18116 | 425 | 11474 | 104 | 11578 | 99.10% | — | 25117 | 73.82% | 15.473 | 49.8175 | 23473 | — |
| Czechia | 2020/12/1 | 455177 | 8407 | 2021/3/1 | 1070622 | 20469 | 615445 | 12062 | 627507 | 98.08% | -1.02% | 1240051 | 87.99% | 15.473 | 49.8175 | 23473 | TRUE |
| Kazakhstan | 2020/6/1 | 5587 | 41 | 2020/9/1 | 102962 | 1878 | 97375 | 1837 | 99212 | 98.15% | — | 131596 | 79.67% | 66.9237 | 48.0196 | 8782 | — |
| Kazakhstan | 2020/12/1 | 148043 | 2477 | 2021/3/1 | 240302 | 3389 | 92259 | 912 | 93171 | 99.02% | 0.87% | 263396 | 92.52% | 66.9237 | 48.0196 | 8782 | FALSE |
| Austria | 2020/6/1 | 15596 | 741 | 2020/9/1 | 23565 | 903 | 7969 | 162 | 8131 | 98.01% | — | 27354 | 89.45% | 14.5501 | 47.5162 | 48716 | — |
| Austria | 2020/12/1 | 227497 | 4205 | 2021/3/1 | 432016 | 10464 | 204519 | 6259 | 210778 | 97.03% | -0.98% | 454870 | 97.28% | 14.5501 | 47.5162 | 48716 | TRUE |
| Croatia | 2020/6/1 | 2077 | 103 | 2020/9/1 | 7735 | 187 | 5658 | 84 | 5742 | 98.54% | — | 10414 | 76.07% | 15.2 | 45.1 | 14808 | — |
| Croatia | 2020/12/1 | 108231 | 1861 | 2021/3/1 | 234635 | 5537 | 126404 | 3676 | 130080 | 97.17% | -1.37% | 243064 | 98.81% | 15.2 | 45.1 | 14808 | TRUE |
| Bulgaria | 2020/6/1 | 1090 | 140 | 2020/9/1 | 11615 | 642 | 10525 | 502 | 11027 | 95.45% | — | 16454 | 74.49% | 25.4858 | 42.7339 | 10761 | — |
| Bulgaria | 2020/12/1 | 53000 | 4188 | 2021/3/1 | 206630 | 10308 | 153630 | 6120 | 159750 | 96.17% | 0.72% | 249626 | 86.91% | 25.4858 | 42.7339 | 10761 | FALSE |
| Italy | 2020/6/1 | 158355 | 33475 | 2020/9/1 | 207944 | 35491 | 49589 | 2016 | 51605 | 96.09% | — | 270189 | 90.10% | 12.56738 | 41.87194 | 32091 | — |
| Italy | 2020/12/1 | 784595 | 56361 | 2021/3/1 | 2416093 | 97945 | 1631498 | 41584 | 1673082 | 97.51% | 1.42% | 2938371 | 85.56% | 12.56738 | 41.87194 | 32091 | FALSE |
| Portugal | 2020/6/1 | 19552 | 1424 | 2020/9/1 | 42104 | 1824 | 22552 | 400 | 22952 | 98.26% | — | 58243 | 75.42% | -8.2245 | 39.3999 | 22299 | — |
| Portugal | 2020/12/1 | 220877 | 4577 | 2021/3/1 | 720235 | 16351 | 499358 | 11774 | 511132 | 97.70% | -0.56% | 804956 | 91.51% | -8.2245 | 39.3999 | 22299 | TRUE |
| Turkey | 2020/6/1 | 128947 | 4563 | 2020/9/1 | 245929 | 6417 | 116982 | 1854 | 118836 | 98.44% | — | 271705 | 92.87% | 35.2433 | 38.9637 | 8798 | — |
| Turkey | 2020/12/1 | 409320 | 13936 | 2021/3/1 | 2578181 | 28638 | 2168861 | 14702 | 2183563 | 99.33% | 0.89% | 2711479 | 96.14% | 35.2433 | 38.9637 | 8798 | FALSE |
| Japan | 2020/6/1 | 14463 | 900 | 2020/9/1 | 57503 | 1314 | 43040 | 414 | 43454 | 99.05% | — | 69018 | 85.22% | 138.252924 | 36.204824 | 41099 | — |
| Japan | 2020/12/1 | 125304 | 2193 | 2021/3/1 | 410448 | 7948 | 285144 | 5755 | 290899 | 98.02% | -1.03% | 433334 | 96.55% | 138.252924 | 36.204824 | 41099 | TRUE |
| Korea, South | 2020/6/1 | 10446 | 272 | 2020/9/1 | 15356 | 326 | 4910 | 54 | 4964 | 98.91% | — | 20449 | 76.69% | 127.766922 | 35.907757 | 33646 | — |
| Korea, South | 2020/12/1 | 28065 | 526 | 2021/3/1 | 81338 | 1606 | 53273 | 1080 | 54353 | 98.01% | -0.90% | 90372 | 91.78% | 127.766922 | 35.907757 | 33646 | TRUE |
| Chile | 2020/6/1 | 44946 | 1113 | 2020/9/1 | 385790 | 11321 | 340844 | 10208 | 351052 | 97.09% | — | 413145 | 96.12% | -71.543 | -35.6751 | 13118 | — |
| Chile | 2020/12/1 | 528034 | 15430 | 2021/3/1 | 784213 | 20660 | 256179 | 5230 | 261409 | 98.00% | 0.91% | 829770 | 97.00% | -71.543 | -35.6751 | 13118 | TRUE |
| Argentina | 2020/6/1 | 5521 | 556 | 2020/9/1 | 308376 | 8919 | 302855 | 8363 | 311218 | 97.31% | — | 428239 | 74.09% | -63.6167 | -38.4161 | 8536 | — |
| Argentina | 2020/12/1 | 1263251 | 38928 | 2021/3/1 | 1911338 | 52077 | 648087 | 13149 | 661236 | 98.01% | 0.70% | 2112023 | 92.96% | -63.6167 | -38.4161 | 8536 | TRUE |
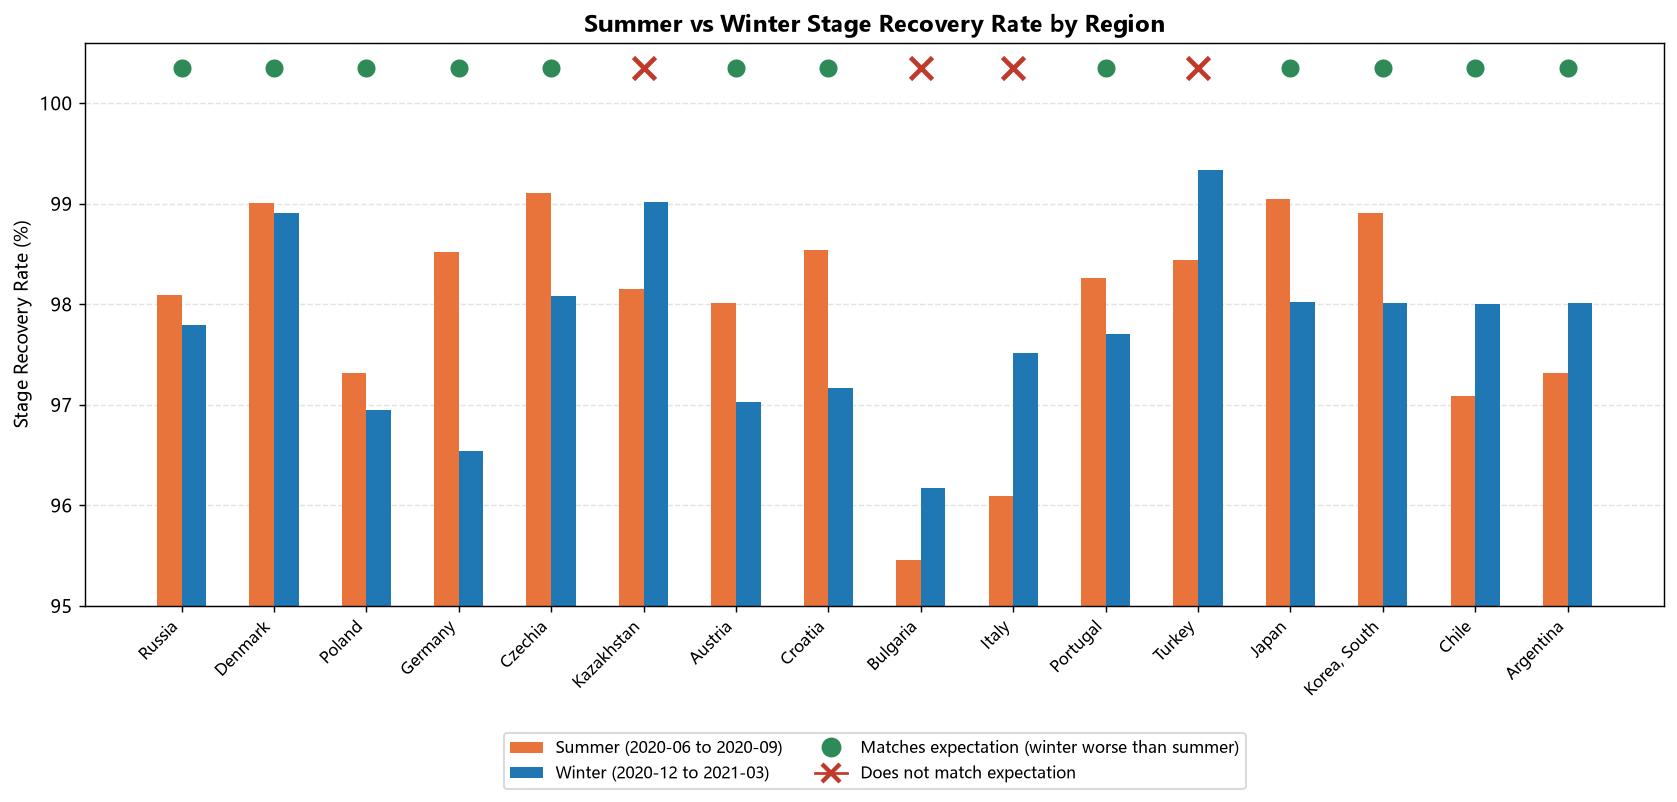
Two additional columns were added: “Recovery Rate Change” and “Expectation.” The Recovery Rate Change is the difference obtained by subtracting the first comparison group’s recovery rate from the second comparison group’s recovery rate for the same region; an Expectation value of TRUE means the region matches the expectation that “recovery is worse in winter than in summer.” The expectation is judged by the local season: in the Northern Hemisphere, December–February is winter and June–August is summer, and the reverse in the Southern Hemisphere.
Summary
A total of 16 regions serve as the comparison, of which 14 are in the Northern Hemisphere and 2 in the Southern Hemisphere. Results: both Southern Hemisphere regions match “recovery is worse in winter than in summer”; 10 Northern Hemisphere regions match and 4 do not (see the preliminary hypotheses below for possible reasons).
This comparison involves several confounding factors that must be acknowledged, and the conclusion can only be treated as an observational correlation. First, the infection–outcome lag (see Section 2): the winter and summer groups actually correspond to cases infected in different seasons. Second, cross-period events: from late 2020 to early 2021, the Alpha variant (B.1.1.7) spread globally and the rate of severe illness rose, while Israel, the United Kingdom, the United States, and others began large-scale vaccination during the same period. The winter interval happened to fall within a window of “stronger variants, vaccines not yet widespread,” whereas the summer interval was the opposite — so part of the winter–summer difference may stem from the timeline of viral variants and vaccines rather than from temperature itself. Third, the absence of statistical testing: none of the differences in the table (e.g., Russia −0.30%, Germany −1.98%) underwent significance testing, and the differences in regions with small sample sizes may be random fluctuations, making it impossible to tell signal from noise.
The four Northern Hemisphere regions that do not match “recovery is worse in winter than in summer” (Kazakhstan +0.87%, Bulgaria +0.72%, Italy +1.42%, Turkey +0.89%) also deserve separate scrutiny. Preliminary hypotheses include: the epidemic was relatively mild in the summer of 2020, and the small sample sizes caused large fluctuations in the recovery rate; the reporting definition of recovery may have been adjusted during the period; and Turkey also made large-scale use of a specific drug intervention in winter. These hypotheses remain to be verified one by one against each country’s original reports.
5. Data for India
Beyond the global overall comparison, let us look at a special case — India.
5.1 Monthly Stage Recovery Rate by Indian State
The state-level data for India come from the covid19india COVID-19 data, and the analyzer tool is used to compute the monthly stage recovery rate for each state.
| Region | Start | Start Recovery | Start Death | End | End Recovery | End Death | Stage Recovery | Stage Death | Stage Total | Recovery Rate | Confirmed | Confidence Rate |
|---|---|---|---|---|---|---|---|---|---|---|---|---|
| India | 2020/4/1 | 169 | 58 | 2020/5/1 | 10021 | 1231 | 9852 | 1173 | 11025 | 89.36% | 37263 | 30.20% |
| India | 2020/5/1 | 10021 | 1231 | 2020/6/1 | 95744 | 5606 | 85723 | 4375 | 90098 | 95.14% | 198372 | 51.09% |
| India | 2020/6/1 | 95744 | 5606 | 2020/7/1 | 359905 | 17848 | 264161 | 12242 | 276403 | 95.57% | 605221 | 62.42% |
| India | 2020/7/1 | 359905 | 17848 | 2020/8/1 | 1146917 | 37410 | 787012 | 19562 | 806574 | 97.57% | 1752171 | 67.59% |
| India | 2020/8/1 | 1146917 | 37410 | 2020/9/1 | 2899528 | 66462 | 1752611 | 29052 | 1781663 | 98.37% | 3766110 | 78.75% |
| India | 2020/9/1 | 2899528 | 66462 | 2020/10/1 | 5348746 | 99807 | 2449218 | 33345 | 2482563 | 98.66% | 6392051 | 85.24% |
| India | 2020/10/1 | 5348746 | 99807 | 2020/11/1 | 7542905 | 122642 | 2194159 | 22835 | 2216994 | 98.97% | 8229324 | 93.15% |
| India | 2020/11/1 | 7542905 | 122642 | 2020/12/1 | 8931803 | 138160 | 1388898 | 15518 | 1404416 | 98.90% | 9499730 | 95.48% |
| India | 2020/12/1 | 8931803 | 138160 | 2021/1/1 | 9905570 | 149255 | 973767 | 11095 | 984862 | 98.87% | 10306471 | 97.56% |
| India | 2021/1/1 | 9905570 | 149255 | 2021/2/1 | 10447450 | 154522 | 541880 | 5267 | 547147 | 99.04% | 10767208 | 98.47% |
| India | 2021/2/1 | 10447450 | 154522 | 2021/3/1 | 10797040 | 157286 | 349590 | 2764 | 352354 | 99.22% | 11124327 | 98.47% |
| India | 2021/3/1 | 10797040 | 157286 | 2021/4/1 | 11522884 | 163428 | 725844 | 6142 | 731986 | 99.16% | 12302115 | 94.99% |
| India | 2021/4/1 | 11522884 | 163428 | 2021/5/1 | 15981938 | 215524 | 4459054 | 52096 | 4511150 | 98.85% | 19549772 | 82.85% |
| India | 2021/5/1 | 15981938 | 215524 | 2021/6/1 | 26171147 | 335116 | 10189209 | 119592 | 10308801 | 98.84% | 28307035 | 93.64% |
| India | 2021/6/1 | 26171147 | 335116 | 2021/7/1 | 29540895 | 400346 | 3369748 | 65230 | 3434978 | 98.10% | 30457549 | 98.30% |
| India | 2021/7/1 | 29540895 | 400346 | 2021/8/1 | 30849685 | 424807 | 1308790 | 24461 | 1333251 | 98.17% | 31695370 | 98.67% |
| India | 2021/8/1 | 30849685 | 424807 | 2021/9/1 | 32021420 | 439561 | 1171735 | 14754 | 1186489 | 98.76% | 32856721 | 98.80% |
| India | 2021/9/1 | 32021420 | 439561 | 2021/10/1 | 33061004 | 448605 | 1039584 | 9044 | 1048628 | 99.14% | 33789420 | 99.17% |
| India | 2021/10/1 | 33061004 | 448605 | 2021/10/31 | 33661339 | 458470 | 600335 | 9865 | 610200 | 98.38% | 34285612 | 99.52% |
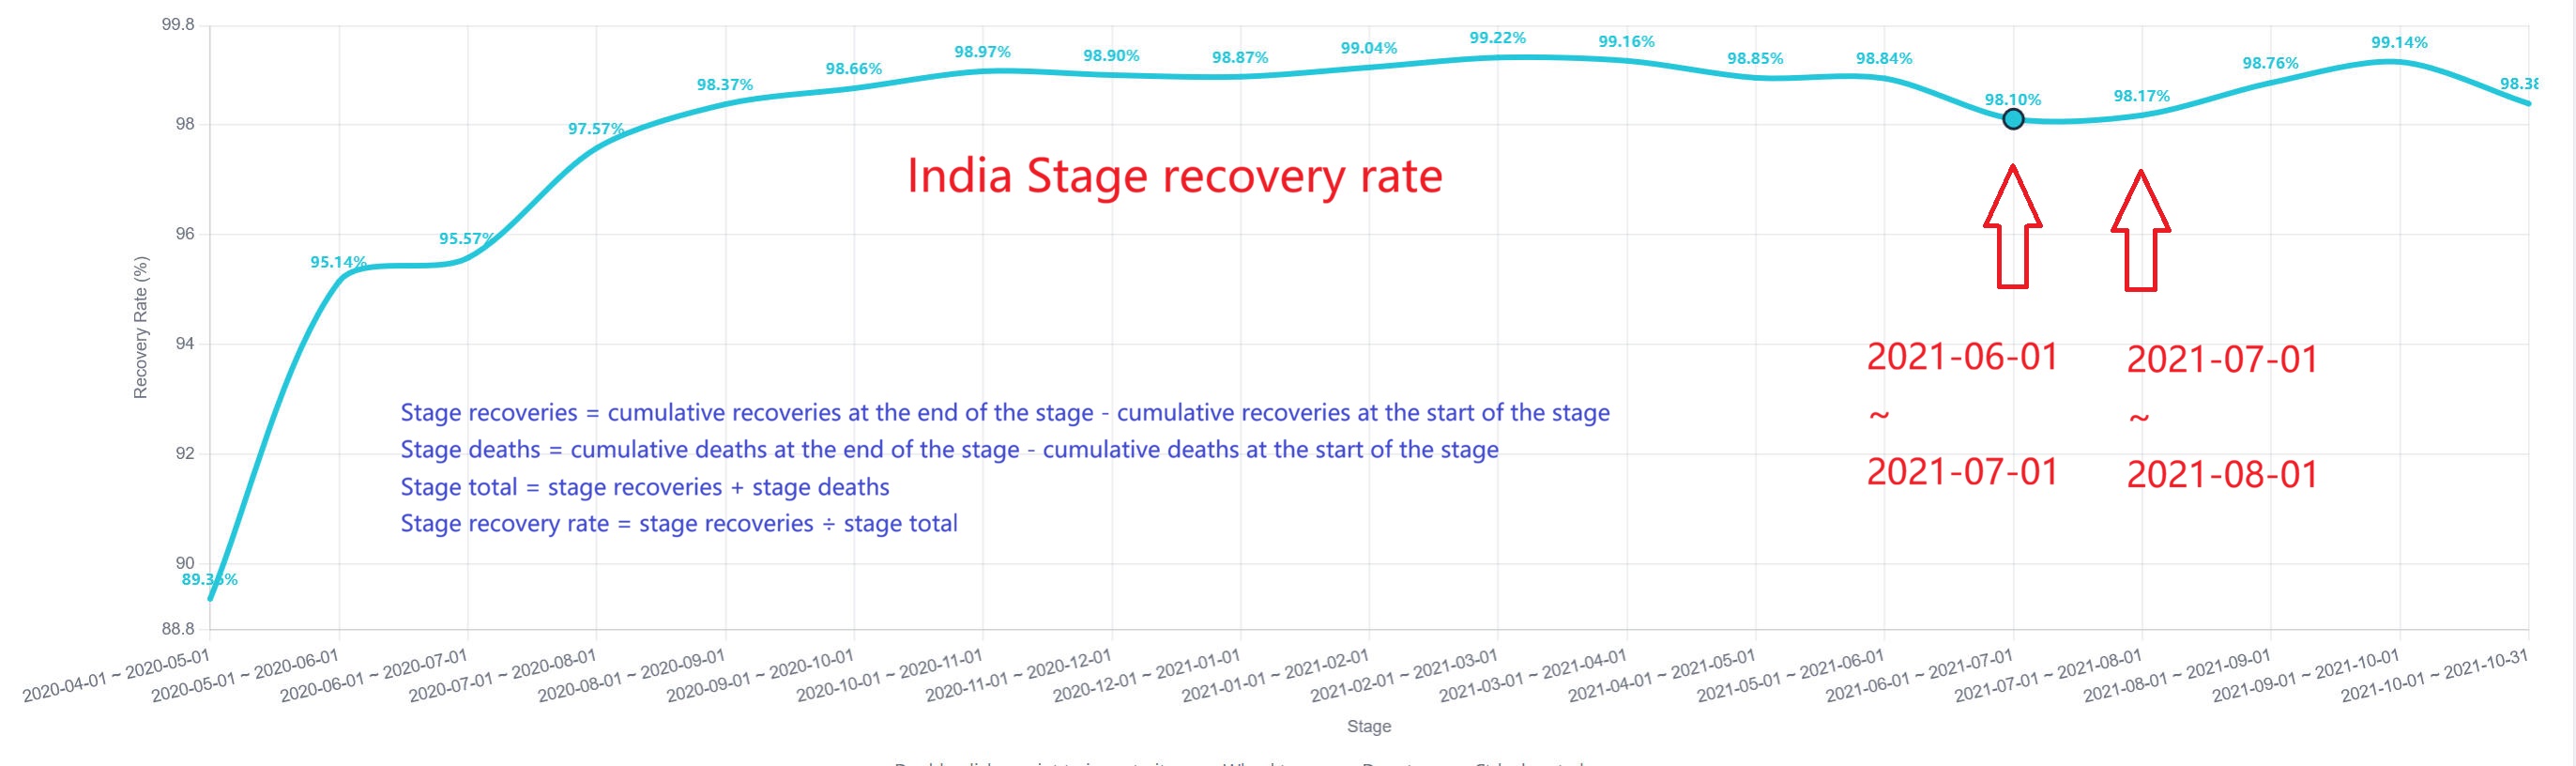
There is too much data, so only India’s overall situation is shown here. In the early stage of the pandemic, the recovery rates of the states were generally poor; in the middle and late stages, the two intervals 2021-06-01 to 2021-07-01 and 2021-07-01 to 2021-08-01 were the worst.
5.2 Monthly Stage Recovery Rate by Indian District
The district-level data likewise come from the covid19india COVID-19 data, and the analyzer tool is used to compute the monthly stage recovery rate for each district.
There is too much data; to view the details for each district, click the analyzer tool link at the beginning of this section and explore it yourself.
Summary
Beyond viral and medical factors, the ambient temperature of Indian summers itself deserves attention. India records heat-related deaths every year, and its summers frequently bring extreme heat, with some regions reaching the “moderately hot” or even “severely hot” level described in Section 1; moreover, with a low GDP per capita, most households find it hard to improve indoor temperature through air conditioning and the like. With the pandemic superimposed on this foundation, the data show that the stage recovery rate of many regions deteriorated markedly in summer.
It must be pointed out, however, that the period from April to July 2021, when India’s recovery rate deteriorated markedly, coincided with the massive outbreak of the Delta variant, the total collapse of the healthcare system, and an oxygen shortage. During the same period, the world observed India’s epidemic spiraling out of control, with large numbers of patients dying because they could not get treatment. Attributing the decline in the recovery rate entirely to high temperature is an overly bold causal leap — healthcare-system overload and viral variants are likely the more direct causes, and high temperature is at most a compounding factor. This precisely illustrates that the “deviation from the comfort zone is harmful” described in Section 1 is only a necessary background, not a sufficient explanation. The India case should therefore be regarded only as an observational scenario of “high temperature superimposed on the epidemic,” useful as circumstantial evidence rather than as confirmation.
6. COVID-19 in Antarctica
For details on the Antarctic research-station case mentioned in Section 1, refer to the following links:
https://en.wikipedia.org/wiki/COVID-19_pandemic_in_Antarctica
https://www.wikiwand.com/en/COVID-19_pandemic_in_Antarctica
The data have not been independently verified and are provided for reference only. To date, the only Antarctic death occurred on a tourist cruise ship, not at a research station.
It should also be emphasized that Antarctic research-station personnel are healthy young adults who have undergone strict screening, and they differ greatly from the general population; even if all of them had only mild symptoms, this cannot be generalized to the general population. This case can only serve as circumstantial evidence in an extreme environment and has no statistical representativeness.
7. Conclusion
Returning to the opening question: does temperature affect COVID-19 recovery? On the whole, the CSSEGISandData COVID-19 data (as of 2021-08-01) and the covid19india COVID-19 data (as of 2021-10-31) both support this conclusion: the top ten regions by full-period recovery rate in Section 3 are almost all concentrated in low-latitude, warm-weather areas; and in the summer/winter comparison of Section 4, 12 of the 16 comparison regions show the pattern that “recovery is worse in winter than in summer” (10/14 in the Northern Hemisphere, 2/2 in the Southern Hemisphere), consistent with the direction of the judgment in Section 1.
Of course, there are also things that cannot be explained: 4 Northern Hemisphere regions do not match the winter/summer pattern, which may relate to small summer sample sizes, definitional adjustments, or medical interventions, and this remains to be verified; the Antarctic case has too small a sample and can only count as circumstantial evidence. In addition, the India data in Section 5 provide an observational scenario of “high temperature superimposed on the epidemic”: the recovery rate likewise worsened during extreme heat, but that period coincided heavily with the outbreak of the Delta variant and healthcare-system overload, so it cannot be independently attributed to high temperature and can only serve as circumstantial evidence. Its direction is consistent with the mechanism that “the relationship between temperature and recovery is not linear — it is best near the comfort zone, while both excessive cold and excessive heat impair recovery,” but it cannot yet be confirmed.
The more accurate conclusion, therefore, is this: the available data are consistent in direction with the hypothesis that “deviation of the ambient temperature from the comfort zone impairs recovery,” but given the confounding factors above, only correlation can currently be established, not causation. Medical conditions, data definitions, and population structure all play a role. This article uses the “stage recovery rate” as a tentative comparison metric, and the metric itself has limitations (it depends on data quality and has subjectively defined stages). Reaching a more reliable conclusion will require larger samples and more rigorous statistics.
Relationship to existing research: the seasonality of COVID-19, the influence of temperature and humidity on transmission and severe illness, and the association between winter vitamin D deficiency and the risk of severe disease have all been studied extensively (including work published in journals such as Nature and Science), and the observational direction of this article is broadly consistent with them. This article does not claim to have discovered any new biological mechanism; its value lies in proposing the “stage recovery rate” metric, providing a reproducible open-source analysis tool, and offering a data-level observational perspective on “worse recovery in the cold season.”
8. Limitations and Directions for Improvement
Requires more data / resources:
- Infection–outcome time lag (see Section 2): the stage recovery rate is computed by outcome time, with a 2–8 week lag relative to infection time. Improvement: realign by infection time, or perform a sensitivity analysis on the lag.
- Confounding by viral variants and vaccines: the winter–summer comparison spans the window of Alpha-variant spread and large-scale vaccination. Improvement: compare periods dominated by the same strain, or include variant/vaccine variables in the analysis.
- Uncontrolled confounding factors: GDP per capita, population age structure, testing strategy, humidity, and vitamin D levels are all uncontrolled. Improvement: supplement the relevant data and run multiple regression.
- Changes in the definition of recovery: the analysis assumes each country’s recovery definition remained stable over the period, but in practice it may have been relaxed. Improvement: check the definition-change records of major countries and, if necessary, correct the data.
- Poor representativeness of the Antarctic case: research-station personnel are a healthy young population and cannot be generalized to the general public. Improvement: larger-scale data covering the general population are needed.
All of the above means that “deviation of the ambient temperature from the comfort zone impairs recovery” should currently be regarded as a correlational observation, not a causal conclusion.